The classic stock-and-bond portfolio rested on a simple idea: when equities fall, government bonds rise, and the two cancel each other out. For three decades that worked. In 2022 it broke. Aggregate bond indices declined 10–15% — the worst year on record for global bonds — at the same time the S&P 500 fell more than 18%. Diversification disappeared exactly when investors needed it most.
The reason is structural. Stocks and bonds are repriced continuously against the same set of macro forces: interest rates, inflation expectations, central-bank policy, and risk appetite. In an inflationary tightening cycle, those forces push both asset classes in the same direction. The volatility of a 60/40 portfolio approaches the volatility of equities alone, without delivering equity-like returns.
Volatility is not a steady drumbeat. It clusters during moments when investors are least able to tolerate it — and that is precisely when public-market assets tend to move together.
This is the structural problem alternatives address. Not by eliminating risk, but by introducing assets whose returns come from contracts, cash flows, and real economic activity — rather than from the market repricing the same instrument every second of every trading day. For a wider tour of the categories under this umbrella, see our overview of alternative investments and the options that exist.
How volatility actually works in a 60/40 portfolio
To understand what alternatives are stabilising, look honestly at each leg of a traditional allocation. Each behaves differently in stress, and the post-2020 numbers are not the ones the textbook covers.
How volatile are equities, really?
Broad equity markets such as the S&P 500 have historically exhibited annualised volatility of 15–20%, with individual years far exceeding that average. In 2008, peak-to-trough losses exceeded 50%. The COVID shock in early 2020 saw equity markets fall more than 30% in a matter of weeks. Even outside crises, double-digit drawdowns occur multiple times per decade. Equities are volatile by design — that is the price paid for the equity risk premium.
Why don't bonds hedge equities anymore?
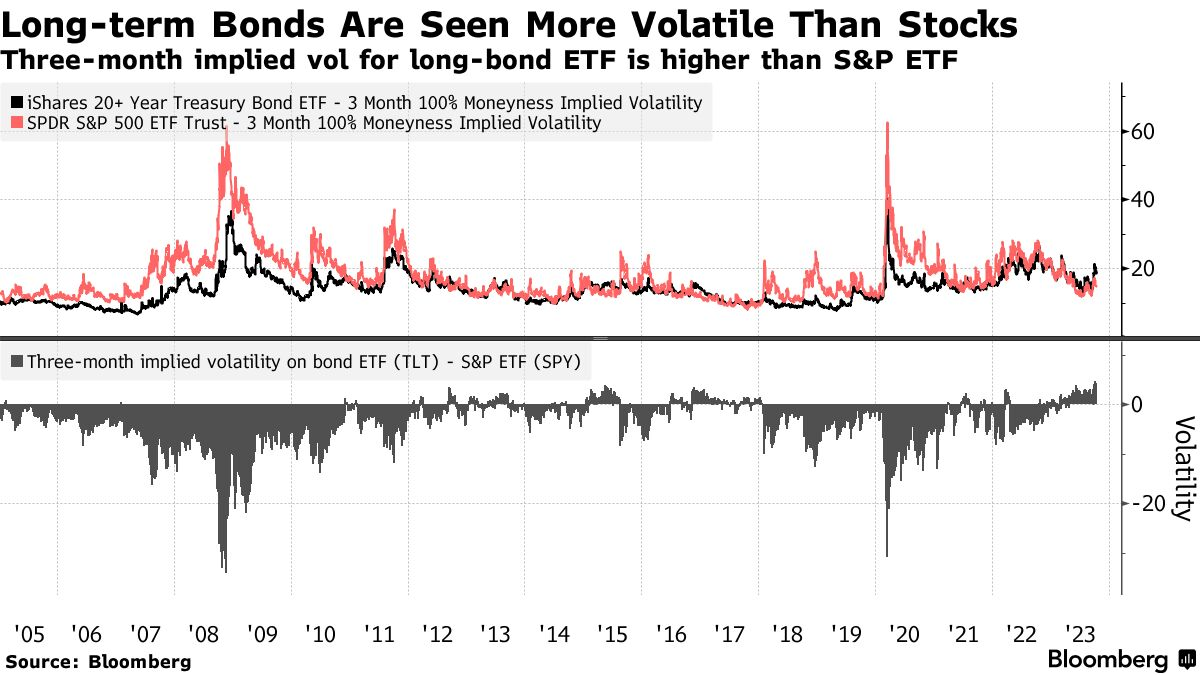
Core government bond indices historically showed volatility closer to 3–6%, which made them effective stabilisers in a balanced portfolio. That relationship has weakened. As policy rates collapsed toward zero and then reversed at speed, duration risk became more pronounced, and the long end of the curve started to behave more like equity than insurance.
Long-duration bonds have been more volatile than stocks. Three-month implied volatility for the long-Treasury ETF has frequently exceeded that of the S&P 500 since 2020. Source: Bloomberg.
In a high-inflation environment, both legs of the 60/40 reprice for the same reason: rising discount rates compress equity valuations and mechanically lower bond prices. The protective negative correlation that defined the previous era flips to a positive one, exactly when investors need it not to.
Is cash actually risk-free?
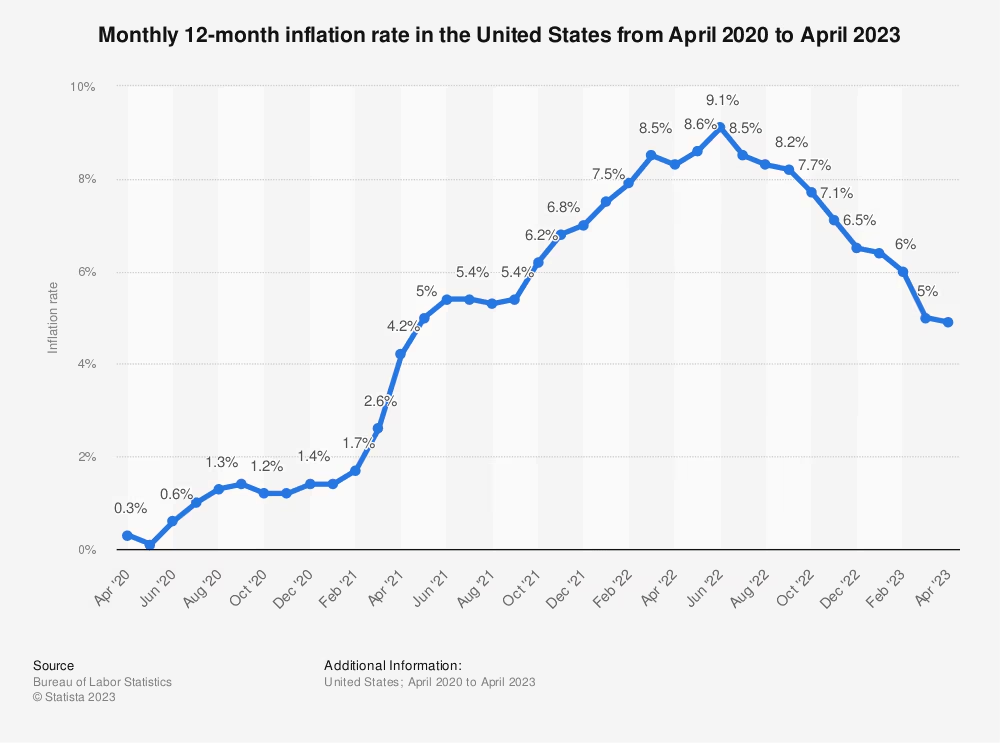
Cash is frequently treated as a volatility-free asset. The nominal price is stable; the real value is not. When inflation runs at 5–9%, as it did across much of 2022, cash silently erodes at the same rate. The chart below shows how quickly that erosion can compound.
Holding cash through a 9% inflation peak is not the absence of volatility — it is volatility booked later. Source: U.S. Bureau of Labor Statistics, via Statista, 2023.
Taken together, a traditional public-markets portfolio typically exhibits portfolio-level volatility in the 10–12% range, with drawdowns that can exceed 20–30% in stressed periods. Cash hedges the surface but not the substance. This is the gap alternatives were designed to fill — and the same gap that motivates many investors to look at crisis-proof investment strategies.
How alternative assets compare on volatility
"Alternative" is a broad word. Some alternatives are designed to deliver steady, contract-based income with minimal sensitivity to public markets; others are driven primarily by price appreciation, sentiment, or scarcity. Treating them as one block is a mistake — the volatility profile differs by an order of magnitude across the category.
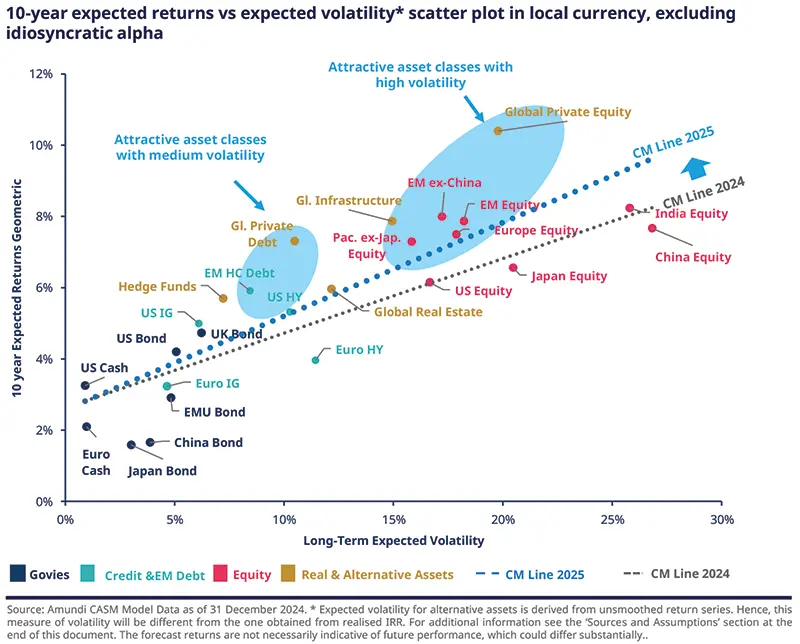
The chart below sets the picture. It plots ten-year expected return against expected volatility for the major asset classes, with the highlighted "Real & Alternative Assets" cluster delivering equity-like or better returns at lower volatility than developed-market equities.
Real and alternative assets sit above the public-market efficient frontier. Global Private Debt, Infrastructure, and Real Estate offer attractive return for the volatility taken. Source: Amundi CASM Model, December 2024.
Translating the picture into estimated annualised volatility bands makes the differences concrete:
Asset class
Estimated annualised volatility
What drives the return
Private credit
~3–6%
Contractual interest payments on senior secured loans, held to maturity.
Crowdlending (well-structured)
~4–8%
Fixed repayment schedules and interest, diversified across borrowers and regions.
Infrastructure
~5–8%
Long-duration contracts and regulated pricing on utilities, toll roads, pipelines.
Forestry
~5–7%
Biological growth that continues regardless of markets; harvest timing flexibility.
Farmland
~6–9%
Lease income, harvests, slow land appreciation; demand stable across cycles.
Hedge funds
~8–12%
Highly manager-dependent; market-neutral or directional, leveraged or unlevered.
Commodities
~15–25%+
Pure price action — supply shocks, weather, geopolitics. No income to absorb swings.
Volatility ranges are sector estimates synthesised from long-run multi-asset studies (Amundi CASM Model, December 2024; long-run private-credit and infrastructure ranges as cited by Cambridge Centre for Alternative Finance, 2024). Estimates only — not a forecast.
The shape of the table is the point. Income-driven alternatives — private credit, well-structured crowdlending, regulated infrastructure, productive land — sit at one end. Price-driven alternatives — most commodity strategies, many directional hedge-fund books — sit at the other. They are not interchangeable. For investors building portfolios that generate monthly income, the income-driven end of the spectrum is doing most of the stabilising work.
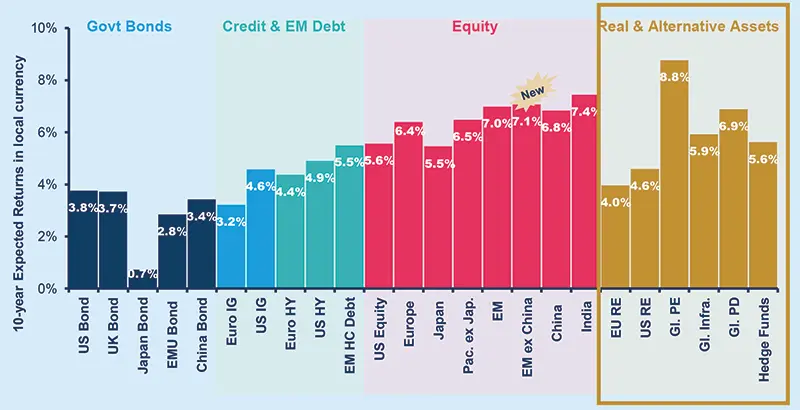
The picture sharpens further when looking at long-run expected returns by asset class. Real and alternative assets — private equity, real estate, infrastructure, private debt, hedge funds — sit in a distinct return band relative to traditional Govt Bonds, Credit, and EM Debt.
Expected return by asset class, 10-year horizon. Real & Alternative Assets — including Global Private Equity (8.8%), Global Infrastructure (5.9%), and Global Private Debt (6.9%) — span a wide return range, much of it competitive with equities. Source: Amundi CASM Model, December 2024.
Why alternatives stabilise portfolios — the four mechanisms
Volatility at the portfolio level is not the weighted average of individual asset volatilities — it is shaped by how assets interact under stress. Income-driven alternatives lower portfolio volatility through four distinct mechanisms.
RepricingPublic equities and bonds are marked to market continuously, so prices adjust the moment macro inputs change. Loans amortise, rent is paid, crops are harvested, trees grow — these processes do not reprice every second on the back of a CPI print. The return path is mechanically smoother.
CorrelationIncome-driven alternatives tend to maintain low — typically 0.1–0.3 — correlation to public markets during inflationary or tightening cycles. Their performance is tied to borrower behaviour, regulated pricing, lease structures, or biological growth, not to the discount rate. They behave like a stabiliser precisely when traditional diversification breaks down.
IlliquidityIlliquidity does not eliminate risk; it removes forced repricing. Assets that don't trade daily are insulated from reflexive selling and momentum-driven flows. Losses, when they occur, unfold through fundamentals rather than panic — which gives a manager time to intervene.
IncomePredictable cash flows — interest payments, lease income, usage-based revenues — absorb price fluctuations over time. Drawdowns become shallower and recovery periods shorter. Even when asset values dip, ongoing income compounds in the background, reducing reliance on price appreciation alone.
Each mechanism reinforces the others. Of all the categories above, contractual private lending — including modern crowdlending — is where all four mechanisms operate at once. That is the segment doing the heaviest lifting for portfolio stability, and the segment our P2P lending guide covers in depth.
Sizing alternatives — and how Maclear fits in
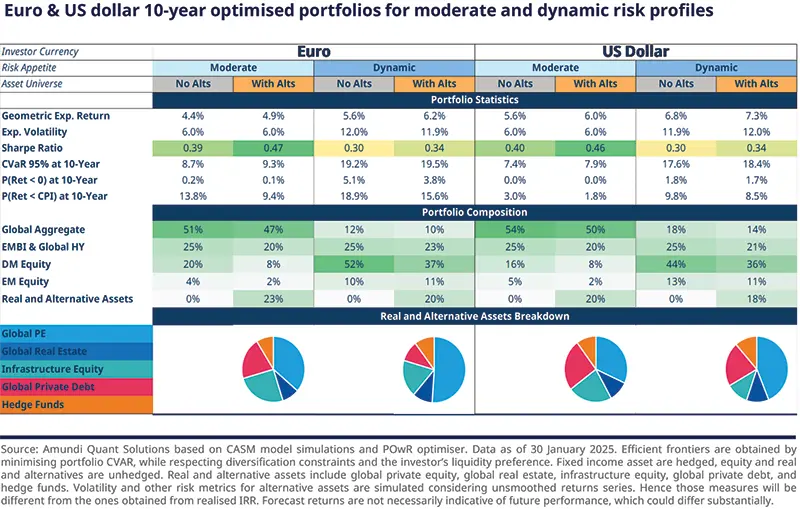
Adding alternatives is not an all-or-nothing decision. Multi-asset model portfolios increasingly carve out a meaningful sleeve for real and alternative assets alongside traditional equity and fixed-income exposure — typically more in dynamic profiles, less in conservative ones, but rarely zero anymore.
Optimised 10-year portfolios for moderate and dynamic risk profiles in EUR and USD. Real and alternative assets feature meaningfully across all four — sized to risk tolerance, not omitted. Source: Amundi.
What does a 10% alternatives sleeve do to portfolio volatility?
The math is simple enough to demonstrate. The standard two-asset portfolio variance formula combines weights, individual volatilities, and the correlation between them:
Worked example — illustrative only
Reallocating 10% from a 60/40 sleeve into private credit
σ²_p = w₁²·σ₁² + w₂²·σ₂² + 2·w₁·w₂·ρ·σ₁·σ₂
Inputs used: 60/40 portfolio volatility σ₁ = 10%; private credit volatility σ₂ = 5%; correlation between the two ρ = 0.2 (low, in line with long-run private-credit studies).
Allocation
Composition
Estimated portfolio volatility
Baseline
100% public 60/40
10.00%
Mix A
90% public 60/40 · 10% private credit
~9.11%
Mix B
80% public 60/40 · 20% private credit
~8.26%
A 10% sleeve trims roughly 9% off portfolio volatility; a 20% sleeve trims roughly 17%. The math depends on the correlation assumption — the lower the correlation between the alt sleeve and public markets, the more meaningful the volatility reduction. Inputs are illustrative; real outcomes depend on actual asset behaviour and rebalancing.
A practical way to think about sizing: alternatives should be large enough to actually shift the portfolio's volatility profile, but not so large that the illiquidity becomes a problem when life — or a tactical opportunity — calls for cash. For most individual investors, a single-digit to low-double-digit percentage commitment to income-driven alternatives is the bracket where the math starts to work. The exact number depends on time horizon and liquidity needs, which is where aligning your strategy with the economic cycle becomes a useful overlay.
Inside that sleeve, the same principle that governs the rest of the portfolio applies: diversification. Spread across borrowers, sectors, jurisdictions, and grades. A single high-graded loan in a single country is not crowdlending diversification; it is concentrated credit risk dressed up as an alternative. For a broader perspective on where lending sits among the choices available, our overview of 12 different types of investments is a useful starting point.
How Maclear structures crowdlending for portfolio stability
The benefits described above only materialise on platforms whose structure matches the theory. A crowdlending platform that under-prices risk, skips collateral, or has no recovery mechanism does not behave like private credit — it behaves like an unsecured high-yield bet. The structural details matter.
Swiss-based Maclear is built specifically for the income-driven, low-correlation profile. Four elements distinguish how Maclear manages risk:
Disciplined underwriting
Every project runs through Maclear's published AAA-to-D borrower scoring system, modelled on international credit-agency standards, and is assigned an internal risk score on a 1–10 scale before being released to investors.
Two-layer protection
Each Maclear loan is backed by reserved collateral. A separate Provision Fund — formed from project commissions — sits behind that, designed to cover temporary repayment difficulties before they touch investor returns. The Provision Fund is not a buyback guarantee on individual claims.
Staged capital deployment
Maclear loans release in defined tranches. Performance on each tranche is observed before the next is released — so investors compound exposure into projects already proving themselves.
Cross-border recovery
In the event of default, Maclear acts directly as the collateral recovery agent and manages legal proceedings across jurisdictions on behalf of investors. Recovery is part of the platform, not outsourced.
The combined effect is a return profile that lives on the income-driven side of the alternatives spectrum: contractual interest, defined repayment schedule, collateral, and a manager who acts when something goes wrong. That is what allows crowdlending to behave as a stabiliser in a portfolio, rather than a higher-yield equity proxy. The detailed mechanics — fees, scoring, Provision Fund, Secondary Market — are documented in Maclear's FAQ knowledge base.
Spotlight — Maclear AG
Swiss-based crowdlending, geographically diversified across Europe
Maclear AG is a Swiss-based P2P lending and crowdlending platform that operates as a financial intermediary in the non-banking sector under Swiss financial regulations and is a member of PolyReg SRO. Maclear focuses on European business loans that banks have passed over or did not price competitively. Each project is graded, collateralised, and offered to investors in tranches with full transparency on terms, grade, and repayment schedule.
Geography is not a marketing feature. It is built directly into the risk framework: borrowers, jurisdictions, and recovery options are spread across Europe so that a single-country shock does not concentrate losses.
Stocks and bonds are repriced against the same macro inputs, so they tend to fall together in inflationary tightening cycles — confirmed in 2022, when global bond indices fell 10–15% alongside an 18%+ S&P drawdown.
"Alternative" is not one asset class. Income-driven alternatives (private credit, crowdlending, infrastructure, farmland, forestry) show estimated volatility of 3–9%; price-driven ones (commodities, directional hedge funds) match or exceed equity volatility.
Alternatives stabilise portfolios through four mechanisms — slower repricing, low correlation (typically 0.1–0.3 vs public markets), illiquidity that prevents forced selling, and ongoing income that compounds through drawdowns.
A 10% private-credit sleeve at 0.2 correlation trims approximately 9% off a 60/40 portfolio's volatility; a 20% sleeve trims approximately 17%. Sizing should reflect time horizon and liquidity needs.
Crowdlending only behaves like private credit when the platform structure supports it — disciplined underwriting, collateral, a Provision Fund, staged capital release, and active recovery. Without those, it is an unsecured high-yield bet.
Maclear AG combines those structural elements into a Swiss-based, PolyReg-SRO-member crowdlending platform with geographically diversified European exposure and contractual cash-flow returns.
Frequently asked questions
Are alternative assets less volatile than stocks?
Income-driven alternatives such as private credit, well-structured crowdlending, regulated infrastructure, farmland, and forestry typically show estimated annualised volatility of 3–9%, compared with 15–20% for broad equity indices. Price-driven alternatives — most commodity strategies and many directional hedge-fund books — can be as volatile as equities or more.
Why don't bonds hedge equities the way they used to?
Stocks and bonds are repriced against the same macro inputs — interest rates, inflation expectations, central-bank policy. In an inflationary tightening cycle, both fall together. In 2022, aggregate bond indices declined 10–15% (CNBC, 2023) while the S&P 500 fell more than 18% in the same year, eliminating the diversification benefit precisely when it was needed most.
Is crowdlending considered an alternative asset?
Yes. Crowdlending is a form of private credit and sits inside the broader alternatives category. Returns come from contractual interest payments on loans rather than from market repricing, which gives crowdlending the low-correlation, income-driven profile that lowers portfolio volatility.
How much of a portfolio should be allocated to alternatives?
There is no single answer — it depends on time horizon, liquidity needs, and risk tolerance. Multi-asset model portfolios from major asset managers typically size real and alternative assets in the single-digit to low-double-digit percent range, scaling up for dynamic profiles and down for conservative ones. The allocation should be large enough to shift the portfolio's volatility profile but small enough that illiquidity does not become a problem.
What is the correlation between private credit and public equities?
Income-driven private credit tends to maintain low — typically 0.1–0.3 — correlation to public equities, particularly during inflationary or tightening cycles. The reason is structural: private-credit returns are driven by borrower repayment and contractual interest, not by daily mark-to-market repricing of a publicly traded instrument.
Does Maclear guarantee returns or buyback?
No. Maclear does not offer a buyback guarantee, and returns are not guaranteed — they depend on borrower performance. Maclear mitigates risk through collateral, a Provision Fund (a reserve formed from project commissions and used to cover temporary repayment difficulties), and continuous borrower monitoring. The Provision Fund is not a buyback guarantee on individual claims.
Is Maclear regulated by FINMA?
No. Maclear AG is a Swiss-based platform that operates as a financial intermediary in the non-banking sector under Swiss financial regulations. Maclear is a member of PolyReg SRO (Self-Regulatory Organisation) and complies with AML, KYC, and GDPR requirements. A FINMA Fintech License is part of the company's future plans, not its current status.
About Maclear
Maclear AG is a Swiss-based P2P lending and crowdlending platform headquartered in Switzerland. The company operates as a financial intermediary in the non-banking sector and is a member of PolyReg SRO, in compliance with Swiss financial regulations including AML, KYC, and GDPR. Maclear offers retail and qualified investors access to vetted business loan opportunities, with built-in risk assessment, a Provision Fund, and a Secondary Market for liquidity.
Disclaimer
The content of this article is provided for informational and educational purposes only. It does not constitute investment, financial, tax, or legal advice. P2P lending and crowdlending investments carry a risk of partial or total capital loss. Past performance is not indicative of future results. Liquidity on a secondary market is not guaranteed. Readers should conduct independent research and consult qualified advisors before making any financial decisions. Availability of products and services may be restricted in certain jurisdictions.
Ready to build a more resilient, geographically diversified portfolio? Browse Maclear's current projects — each with full grading, collateral details, and tranche structure.