Inside Maclear's Growth: Understanding Our Statistics and Monthly Snapshots Pages
17.03.2026
6
Updated:
29.07.2026
In digital crowdlending, transparency is not a feature — it is the foundation of trust. Unlike traditional financial institutions, where performance is often disclosed through quarterly reports or selective metrics, crowdlending platforms must allow investors to see how capital moves in real time, how the platform evolves, and how reliably obligations are met. Keeping access to these dynamics in their entirety is essential for making informed, long-term decisions.
Maclear addresses this need through two complementary data tools: the Statistics page and the Investor Updates page. Together, they provide a clear, verifiable picture of the platform's performance, growth, and operational health. While the Statistics page presents cumulative, all-time figures, the Investor Updates page reveals how the platform has developed over shorter, month-by-month intervals.
Below, we give you an overview of what each page reports, why this data matters, and where performance is headed.
Unlike traditional investments, where performance is filtered through annual reports or opaque fund structures, crowdlending platforms are defined by the quality and transparency of their data. Deposit flows, investment volumes, repayment dynamics, and participant growth all offer real-time insight into how we actually operate. These indicators help distinguish sustainable growth from short-term spikes and allow for independent assessment of the platform's health, regardless of promotional cycles or outdated reports.
By publishing both cumulative platform statistics and detailed monthly investor updates, we allow stakeholders to evaluate performance from two complementary angles: the long-term trajectory and the short-term momentum.
The Statistics Page: Maclear's Overall Track Record
Maclear's Statistics page is designed as a high-level, numbers-first overview of the platform's performance. Rather than commentary or interpretation, it focuses on clear, verifiable metrics — aggregating all key indicators into one place, combining cumulative totals with recent monthly activity.
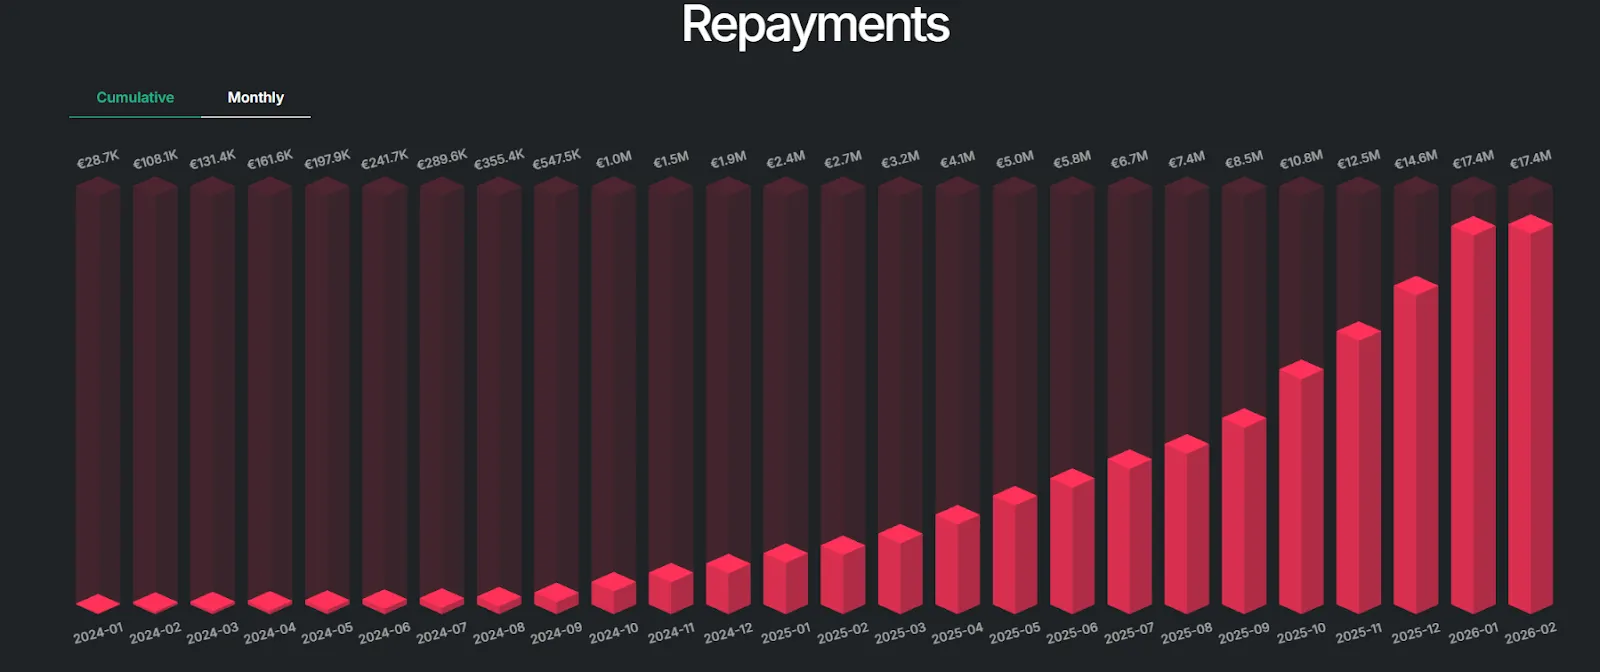
As of January 31, 2026, €2.7 million was repaid in that month alone. The Statistics page also provides structural insights beyond raw volumes: geographic distribution of projects and investor origins, industry exposure, and total scale. With 1,104 projects funded and 34,285 investors on the platform, the operational breadth is clear at a glance.
What makes this page especially valuable is its cumulative perspective. By showing totals rather than isolated periods, it allows participants to evaluate platform health without noise. Growth in deposits, investments, and repayments can be viewed as part of a continuous trend — helping investors judge whether expansion is consistent and sustainable.
Investor Updates Page: Monthly Snapshots of Platform Momentum
While the Statistics page shows the big picture, Maclear's Investor Updates page is where that growth comes to life month by month. These updates are published as regular snapshots that break down how the platform performed over a specific period, translating cumulative growth into concrete, recent activity that investors can analyse and track over time.
Each monthly update follows a consistent structure, focusing on the most relevant operational metrics. It typically starts with the total track record, placing the month in context by showing all-time investments and registrations alongside new growth during that period. From there, the updates break down stakeholder activity: deposits and investments are reported separately, highlighting both fresh capital entering the platform and funds actively deployed into live projects. Geographic, project, and industry breakdowns show where investor interest is concentrated — often revealing shifts in participation across countries.
Repayment Section: Each monthly update reports how much principal was repaid, how many investors received payouts, and which project stages were completed. This is especially important for assessing platform reliability — it shows real capital returning to investors on schedule, not merely new money being deposited. Browse the latest monthly snapshot: Maclear Investor Update: February 2026 Highlights →
Reading Capital Flows
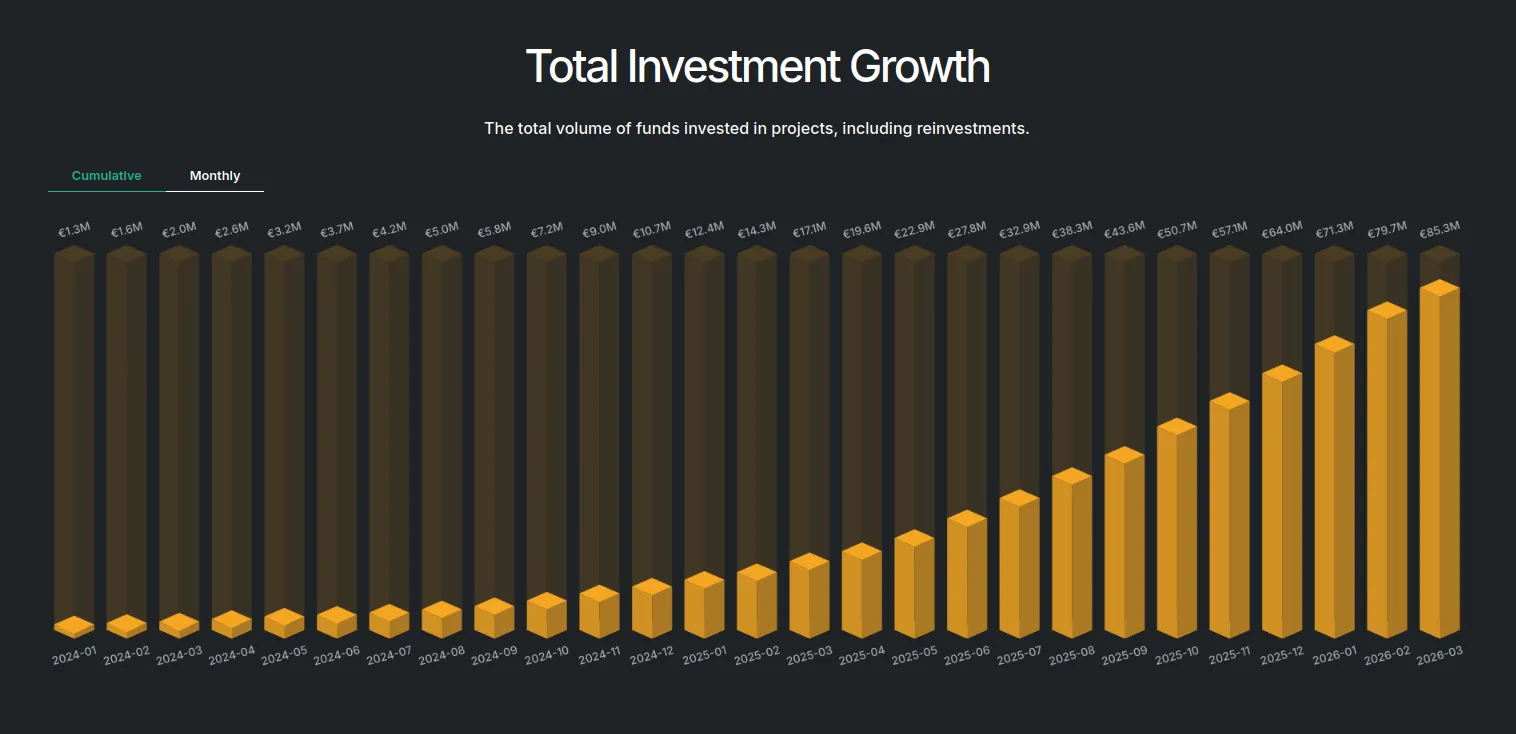
Deposits reflect investor confidence. When cumulative deposits continue to grow, it shows that investors are not only joining the platform but are willing to allocate fresh capital to it. As of January 31, 2026, Maclear's cumulative deposits reached €60.2 million — signalling sustained trust in the platform's structure and project quality.
Investments, on the other hand, measure capital velocity: how effectively deposited funds are put to work. With €70.7 million invested cumulatively, incoming capital is actively allocated to vetted projects rather than sitting idle.
When investments consistently outpace deposits in a given month, it typically indicates strong borrower demand and efficient project onboarding — supported in our case by secondary market activity and the reinvestment of returned principal. Repayments complete the picture by confirming repayment discipline and portfolio health. To understand how the platform handles the rare cases where repayment is delayed, see our article on how we managed our first — and only — default, with 100% investor recovery.
Geographic Distribution
Our statistics reveal a deliberate geographic balance between where projects are financed and where capital originates. Maclear is based in Switzerland — well-known as a hub of robust regulatory practice and secure finance. On the project borrower side, however, Switzerland has stiff competition from traditional banks, where interest rates are competitive and low. We primarily serve areas where credit availability is more restricted and returns are more lucrative.
Most Profitable Project Markets
These are primarily Southern Europe, the Balkans, and Eastern Europe. Small and medium-sized businesses in these regions often operate in less saturated markets, while access to traditional bank financing is slower and tied to hard collateral. This creates genuine demand for alternative financing — allowing us to structure loans at higher interest rates that remain economically viable for borrowers. For investors, this translates into stronger yield potential rooted in real business economics rather than excessive leverage or speculative risk. For a deeper look at this dynamic, see our article on P2B lending in Eastern Europe and Maclear's approach.
Investor Flows
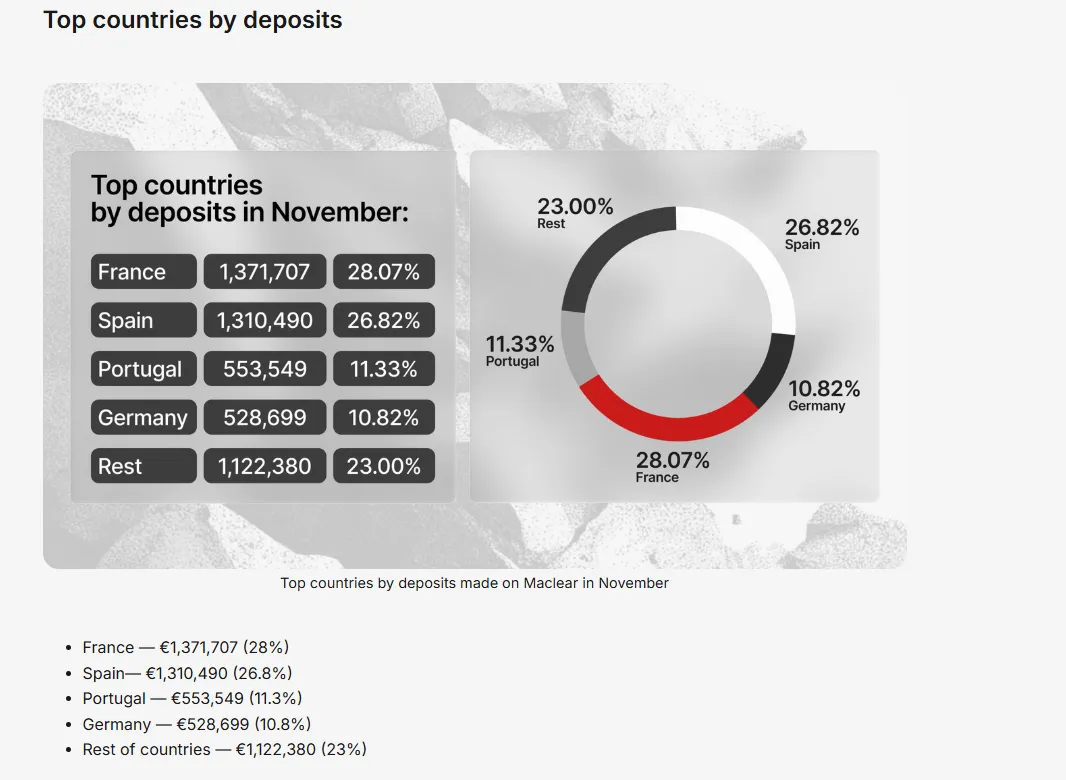
Most recently, France accounted for roughly 22% of investor inflows, followed by Portugal at 20% and Spain at 19%, with the remaining 38% distributed across other countries. This concentration reflects a mature capital base with strong familiarity with cross-border investing and growing interest in structured, high-yield private debt.
Deposit Flows
The same countries also dominate deposit flows, reinforcing the consistency of investor engagement. France has led deposits at approximately 28%, followed by Spain at 26.8%, Portugal at 11.3%, and Germany at 10.8%, with the remainder distributed across other markets.
Taken together, this geographic split highlights the platform's core strength: capital is raised in stable, capital-rich economies and deployed into regions where capital is scarcer but returns are structurally higher. Meanwhile, we apply rigorous borrower approval criteria — rejecting up to 90% of applicants — and have recorded only one default in the company's history, which was fully resolved through collateral recovery, without touching the Provision Fund.
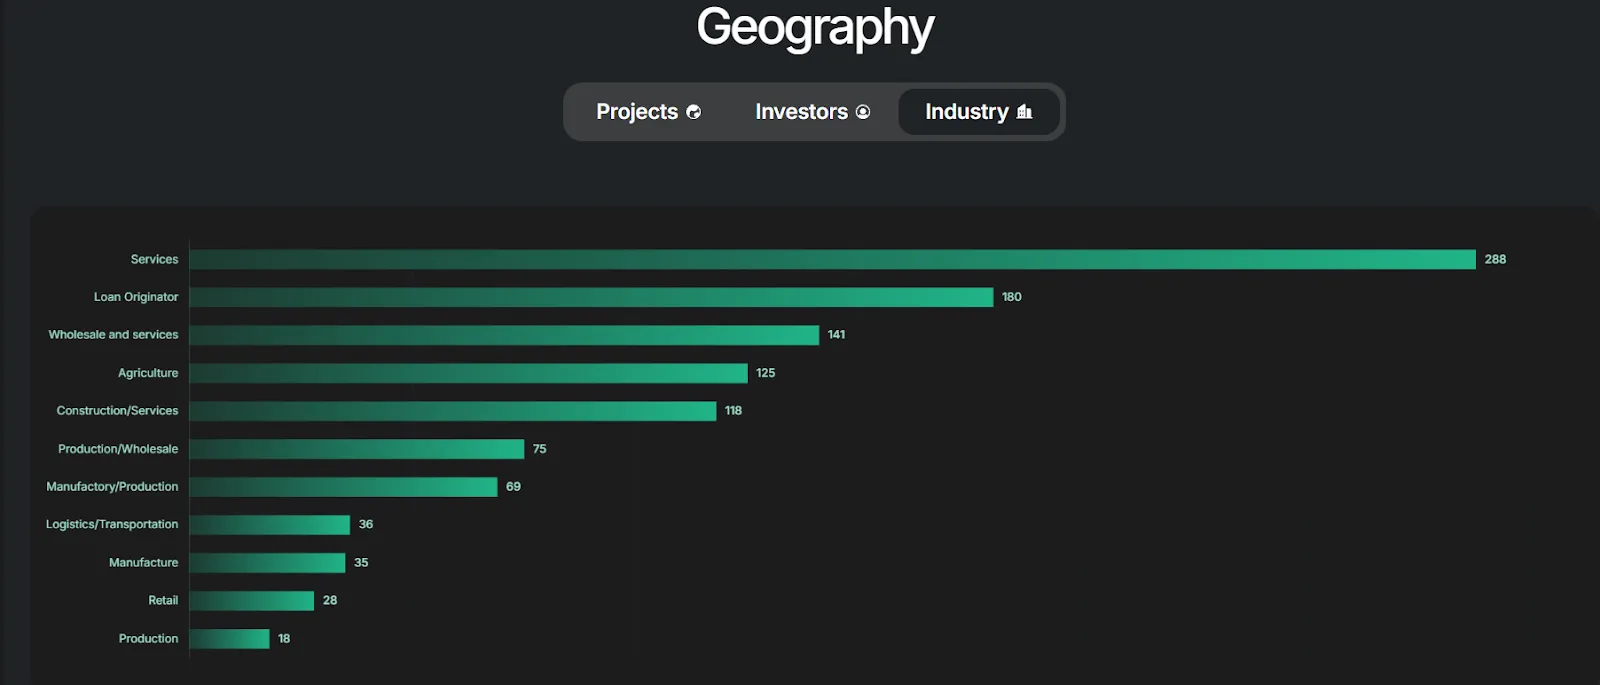
Sector Distribution
The sector breakdown on both pages shows what kinds of real businesses are being financed and how exposure is spread across different parts of the economy. For a broader discussion of how sector diversification strengthens a portfolio, see our guide on diversification strategies in P2P lending.
Retail
Offers higher yields due to growing consumer demand and market expansion in emerging economies. Staged loan disbursements allow investors to participate in retail growth with mitigated risk.
Wholesale & Distribution
High-turnover businesses with predictable margins. Loans are structured around inventory cycles or contract obligations, with collateral assessed against stock or receivables.
Services
Consulting, logistics, IT, and professional services offer predictable recurring cash flows, making them well-suited to structured loan repayment schedules.
Agriculture
Essential, recession-resilient industries tied to tangible assets — equipment or land — that serve as reliable collateral. Seasonal cash flows are clearly measurable.
Green Energy
Renewable energy projects, including solar, wind, and bioenergy, offer long-term growth potential, strong regulatory support, and socially responsible investment opportunities.
Microfinance & SME Lending
Fintech and microfinance firms providing loans to local SMEs — a growing segment driven by high demand and flexible repayment structures, assessed on robust underwriting criteria.
Conclusion
Maclear's Statistics and Investor Updates pages are built on a simple principle: if you can measure it, you can trust it. Together, they give investors a complete, unfiltered view of how capital flows through the platform — from deposit to deployment to repayment. Whether you're evaluating long-term trajectory or tracking monthly momentum, these tools provide the foundation for confident, data-driven investing.