Most investors watch their portfolios closely — tracking prices, monitoring positions, and reading the news. Yet one of the most consistent forces shaping long-term outcomes is rarely scrutinised: fees. They do not arrive with a headline or a market shock. They are deducted quietly, in fractions of a percent, and they compound in exactly the same way returns do — only in the opposite direction.
What makes fees especially powerful is their certainty. Markets rise and fall; fees are charged regardless of performance. In strong years they skim gains. In weak years they deepen losses. Over long horizons, this steady drag can eclipse the impact of short-term market volatility.
Why small percentages have outsized effects
A fee of 0.5% or 1% sounds trivial in isolation. On one year's balance it barely registers. The problem is that fees are not a one-time cost — they are applied year after year, and every deduction reduces the base on which future growth compounds. Every euro paid in fees is not only gone; it also loses the ability to earn future returns.
Consider two investors, each starting with €100,000 and earning a 7% gross annual return over 30 years. The only difference is the annual fee each one pays.
| Investor | Annual fees | Ending balance (30 yrs) |
| Investor A | 0.25% | ≈ €710,000 |
| Investor B | 1.50% | ≈ €508,000 |
| Difference | 1.25 pp | ≈ €200,000 (≈ 28% of final value) |
Same market return, same starting capital, same time horizon. A single extra percentage point of fees, compounded, removes roughly a quarter of the final portfolio. Few statements display this cumulative drag — most show only the annual figure, which reads as inconsequential.
Controlling recurring costs is one of the most reliable ways to improve long-term outcomes — without taking on additional market risk.
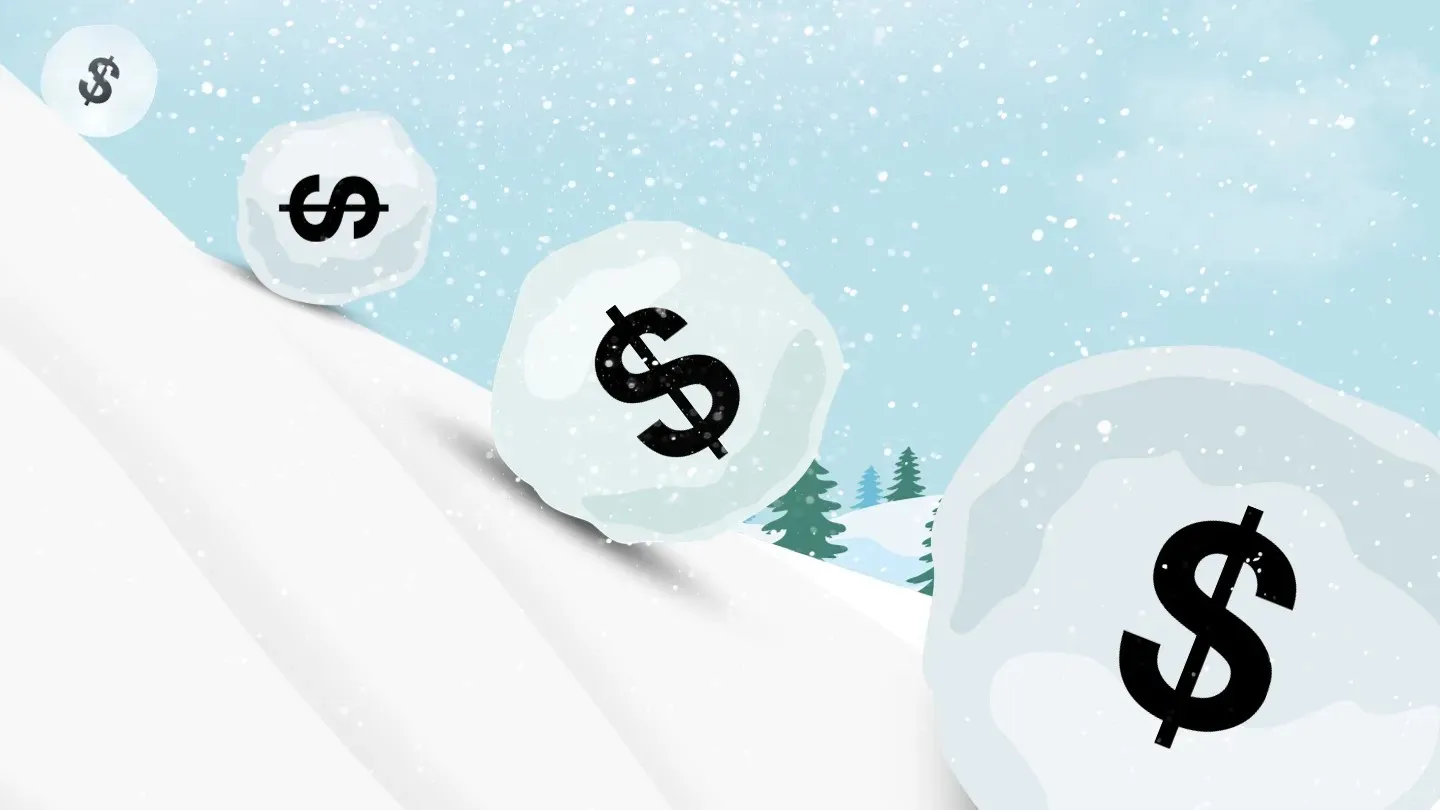
The snowball effect of reinvested income works in both directions, and fees are the force pulling the snowball apart.
Fees by investment management class
Investment costs are rarely confined to a single line item. They appear in layers — some charged externally by an advisor or broker, others embedded inside the product itself. Understanding the full stack is the first step toward controlling it.
External
Advisory and portfolio management fees charged as a percentage of assets, usually between 1%–2% per year.
Transactional
Sales loads, ongoing distribution charges, and trading commissions tied to buying or selling.
Embedded
Fund expense ratios, deducted directly from mutual fund or ETF assets before any return is reported.
Wrapped
Insurance-embedded products such as variable annuities, which layer mortality, administrative, and rider charges on top of the underlying investments.
Advisory and portfolio management
When a registered advisor manages your assets, the most common cost is an ongoing management fee calculated as a percentage of assets under management (AUM). According to Morningstar's annual US Fund Fee Study, advisory fees typically range between 1% and 2% per year, though competitive pressure and robo-advisor automation have pushed the industry average closer to 1%.
These fees are often tiered — declining as portfolio size increases — and they are negotiable. In the United States, advisors must disclose their fee schedule in Form ADV filed with the SEC. European investors should ask for the equivalent cost disclosure under MiFID II ex-ante and ex-post reporting rules.
Sales commissions
Some products are sold on commission rather than managed for a fee. Sales loads — charged at purchase or redemption — typically fall between 3% and 8% of the invested amount, depending on the product structure. Ongoing distribution charges (for example, 12b-1 fees in the United States, or retrocessions in parts of Europe) add another 0.25% to 1% per year. Over long holding periods these recurring charges can exceed the upfront commission several times over. FINRA's guidance on mutual fund fees and expenses explains how each category interacts.
Execution and custody fees
Trading commissions have fallen sharply in recent years. Most major brokers now offer zero-commission trades on a wide list of ETFs and equities. Custody fees for holding the assets themselves still apply at many institutions, usually as a flat annual amount or a small percentage of AUM. These costs are generally modest, but they scale quickly for active strategies with high turnover.
Fund expense ratios
Every mutual fund and ETF charges an annual operating expense, deducted directly from fund assets and reflected in its reported returns. According to the Investment Company Institute's annual review of fund expenses, expense ratios typically range from 0.05% at the low end — broad-market index ETFs — to over 2% for niche, actively managed strategies. Funds focused on domestic public markets tend to be cheaper; international, emerging-market, and thematic exposures cost more because of complexity and trading friction.
Marketing and distribution charges are frequently bundled into the headline expense ratio, making them easy to miss when comparing funds by performance alone.
Insurance-embedded products
Investment products wrapped inside insurance structures — variable annuities, unit-linked life policies, and certain structured products — are typically the most expensive vehicles available to retail investors. Total annual costs of 2.5% to 4% are common once mortality, administrative, rider, and early-surrender charges are aggregated. Tax treatment is sometimes used to justify those levels, but the compounding effect of a 3% annual drag almost always dominates the tax benefit over realistic holding periods.
Low returns make costs more dangerous
Fees are always a drag, but their impact becomes far more severe when returns are modest. In high-growth markets, costs feel tolerable because gains mask the leakage. In lower-return environments — statistically more common across long horizons — fees claim a much larger share of what investors actually earn.
Losing 1% per year to costs is inconvenient when markets return 10%. It is structurally different when returns are 4%. In the latter case, a quarter of the growth disappears before compounding even begins. Over decades, that margin determines whether capital grows meaningfully or merely keeps pace with inflation — a dynamic we unpack in detail in our guide on how inflation impacts long-term wealth.
Low-cost structures and crowdlending
One way disciplined capital allocation shows up in practice is through instruments designed to limit unnecessary activity in the first place. Crowdlending is a clear example. Rather than relying on constant trading decisions or market timing, capital is deployed into defined-duration loans with clearly stated yields and repayment schedules.
This structure naturally reduces many of the cost pressures outlined above. There is no incentive for frequent buying and selling, no turnover-driven tax churn, and far fewer layers of embedded charges. Returns are driven primarily by loan performance rather than short-term price movements, which makes outcomes easier to evaluate and plan around.
Spotlight — Maclear AG
Swiss crowdlending built for low-turnover, low-drag investing
Maclear is a Swiss-based crowdlending platform built around exactly this principle. Each project is graded on a proprietary AAA-to-D credit scale, modelled on the approach of leading credit agencies and assessed by Maclear's in-house credit team before being offered to investors. Yield expectations are stated upfront, repayment schedules are fixed in advance, and turnover is minimal — all of which keeps fee and tax drag structurally low compared with actively managed equity or fixed-income products.
Two features distinguish the risk framework. First, loans are backed by collateral — physical assets pledged by the borrower, with Maclear acting as collateral agent on behalf of investors. Second, a provision fund provides an additional buffer, absorbing losses before they reach investor capital.
AAA–D
Credit grading scale
2-layer
Collateral + provision fund
For context on how yield and risk interact in this segment, see our analysis of why high yield in P2P lending does not always mean high risk, and our guide on diversification in P2P lending.
View current projects → Costs for active vs. passive investors
Investors generally fall into two camps. Passive investors follow the broad market — typically through index funds — and trade rarely. Active investors make more frequent positioning decisions, aiming to outperform through timing or security selection. Our full comparison of active vs. passive investing unpacks the wider trade-off, but on the cost side alone the gap is wide.
How often assets are bought and sold drives overall cost in two ways. First, each transaction can incur charges. Second, and more materially, each realised sale is a potential tax event. Short-term gains are taxed at higher rates than long-term gains in most jurisdictions, and repeated turnover can generate tax liabilities even in years when net performance is unremarkable.
Why patient capital compounds more efficiently
Lower-turnover approaches avoid much of this friction. By holding positions for longer periods, taxable gains are deferred rather than realised annually. Capital that would otherwise be paid out in taxes remains invested and continues to compound. When gains are eventually realised, they are more likely to qualify for long-term capital-gains treatment, which carries a lower rate in most jurisdictions.
The effect is especially pronounced in taxable accounts. Regular distributions and realised gains quietly reduce after-tax returns year after year, even when headline performance looks solid. Our dedicated guide to tax-efficient investing examines the specific account structures and allocation rules that preserve the most value over time.
Reducing cost drag without sacrificing outcomes
The most effective response to fee drag is not chasing the lowest headline cost; it is being intentional about where and why costs exist.
- Full stack Fees that are disclosed, easy to track, and tied to long-term outcomes are less harmful than layered, opaque costs that compound unnoticed. Read the prospectus and the key information document, not the marketing page.
- Consolidate Holding fewer, well-understood vehicles reduces duplication — paying multiple layers of management for similar exposures is a common, silent tax. Simpler structures are also easier to monitor.
- Purpose Pay for expertise, discipline, or access where it materially improves results. Minimise spend everywhere else. The goal is not zero cost; it is every euro of cost having a clear job to do.
Measuring the result matters as much as structuring the inputs. Our guide to calculating investment returns — IRR, ROI, ROE, and ROIC covers the metrics that correctly account for fees and taxes, so you can judge what you are actually earning rather than what a headline figure suggests.
Frequently asked questions
How much do investment fees actually reduce long-term returns?
Over 30 years at a 7% gross return, every additional 1% in annual fees reduces the final portfolio value by roughly 20–25%. A difference of 1.25 percentage points — typical between a low-cost index ETF and a traditional managed mutual fund — can remove more than a quarter of final wealth.
What is a reasonable total fee level for a long-term portfolio?
Most low-cost, diversified portfolios can be built for an all-in annual cost of 0.20%–0.50% using broad-market ETFs. Crossing above 1% total fees needs a clear justification — specialist expertise, illiquid access, or structured risk controls — because the compounding cost is substantial.
Are fees worth paying if an advisor outperforms the market?
Empirical evidence shows that persistent net-of-fees outperformance is rare. Even where skill exists, the fee itself sets the hurdle: a 1.5% annual charge requires the manager to beat the benchmark by 1.5% per year just to break even. Over decades, very few managers do so consistently.
How do taxes compound with fees?
Taxes and fees interact multiplicatively rather than additively. Frequent turnover converts long-term gains into short-term gains, which are usually taxed at higher rates, while each realised sale also takes capital out of the compounding pool. Lower-turnover strategies protect both the fee and the tax streams at once.
Do crowdlending platforms carry hidden fees?
They can, but the structure is typically simpler than managed public-market products. On Maclear, the investor-facing yield is stated upfront and repayments are made on a defined schedule. The main costs are priced into the project terms rather than layered as recurring management charges on top.
Conclusion
Over long horizons, outcomes are shaped less by brilliance and more by behaviour. Intelligence may help identify opportunities, but discipline determines whether gains are actually kept. Fees, taxes, and unnecessary activity work against undisciplined strategies quietly and consistently — they do not require bad decisions to cause damage, only inattention.
This is why structure matters. Systems that reduce friction, limit impulsive action, and make costs visible tend to outperform clever but complex approaches over time. Discipline shows up not as restraint for its own sake, but as consistency: fewer moving parts, fewer forced decisions, and fewer leaks along the way.
Maclear is built around that principle — Swiss-regulated, collateral-backed crowdlending with a provision fund, transparent AAA-to-D grading, and predictable repayment schedules that limit the fee and tax drag that quietly erodes most portfolios.
Ready to see how disciplined, low-turnover crowdlending fits alongside the rest of your portfolio? Browse Maclear's current investment projects — each with full grading, collateral details, and tranche structure.
See open projects